Graphical representation of the tRFs obtained for nifH of N2-fixing and nosZ of denitrifying microorganisms.
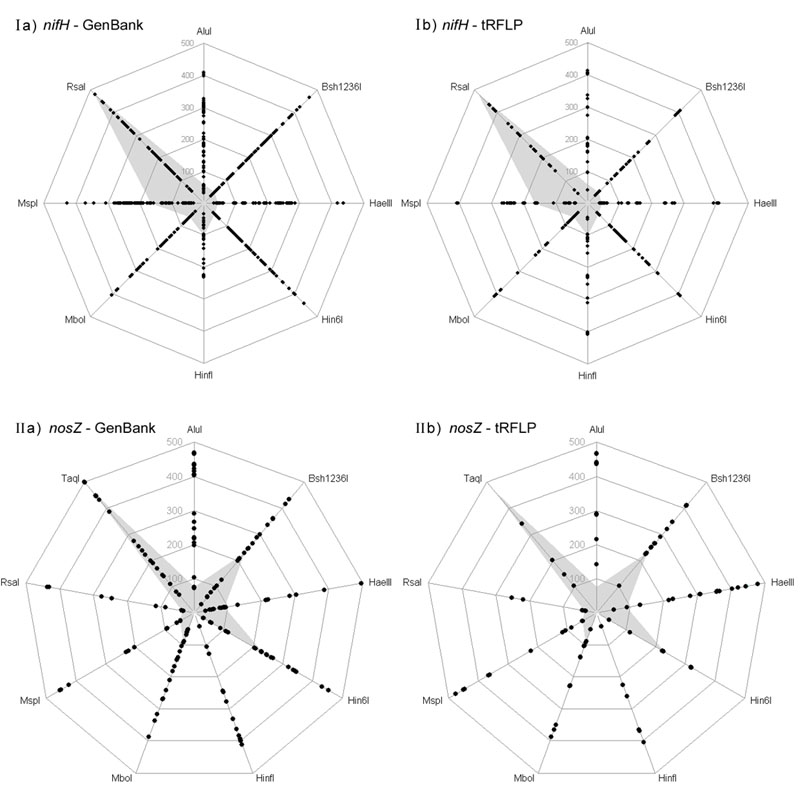
| I. nifH: | a) tRFs derived from the sequences deposited in GenBank |
| b) tRFs experimentally obtained from the DNA isolated from the Dünnwald soil | |
| II. nosZ: | a) tRFs derived from the sequences deposited in GenBank |
| b) tRFs experimentally obtained from the DNA isolated from the Dünnwald soil |
The shaded polygon symbolizes the sequence derived tRFs for Azospirillum brasilense Sp7. The length of the tRFs is given on the axes in the range of 0 to 500 nt.
Note that these polygons are graphical representations for demonstration purposes only!