Identification of polygons representing organisms in the Dünnwald soil in two libraries.
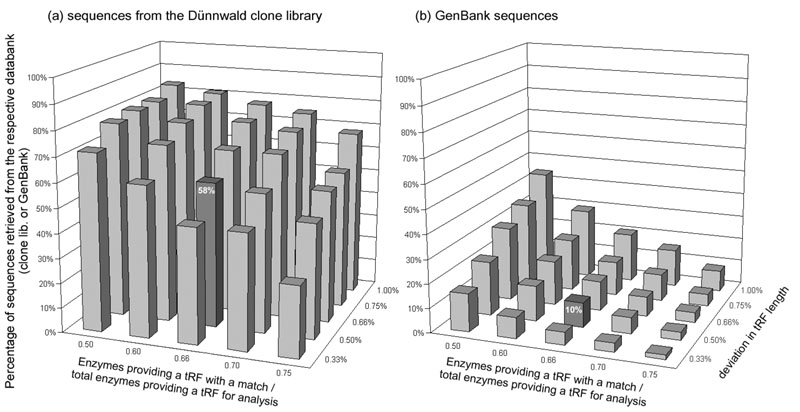
DNA was isolated from the Dünnwald soil and the length of the tRFs obtained with all 13 restriction enzymes was experimentally determined for the 16S rRNA gene. The lengths of the tRFs were then compared with those calculated from the sequences a) of the Dünnwald clone library, b) of GenBank. The ordinate represents the percentage of polygons of the soil DNA among the total polygons of either the Dünnwald clone library (a) or the GenBank sequences (b).
One abscissa (front side) denotes the proportion of enzymes providing a tRF with a match referred to the total number of enzymes employed and providing tRFs for analysis. The other abscissa (right side) denotes the deviation in the length of the tRFs.
The percentage of sequences retrieved was low when the deviation was restricted to be ≤ 0.33 % and high at a deviation of ≤ 1.00 %. For the further calculations, the values 0.66 (for the number of matches) and 0.5 % (for the deviation) were selected (dark column in both parts of the figure). However, score values of either 1.0, 0.5 or 0.25 (for definitions see text) were taken for the calculations and this figure.